Thought Leadership
Putting Students at the Center of School Redistricting: Data, Modeling, and Equity

Due to declining birth rates and growing numbers of parents who are using school choice options, districts across the country are facing tough decisions around facility planning, including redistricting school boundaries. School boundary redistricting is one of the most challenging processes that school district leaders and board members lead. Discussions around changing a neighborhood school are emotional for parents and the community, especially if consolidation is on the table. These processes are complex, as they often have multiple (sometimes competing) purposes: balancing enrollment, adding or moving programs, building or consolidating schools, and increasing equitable access for students. Then add to these factors the goals of district leadership and board members, family priorities, and community values and it can be hard to see a clear path forward that reflects these divergent viewpoints. That’s where my team comes in.
So how can district leaders effectively lead these processes in a way that honors these perspectives and results in boundaries that best serve students? In my experience working with school districts across the nation, I have found that there are three key components of effective boundary redistricting that integrate the specific needs of each project:
1. Guiding Principles for Redistricting
At the outset of any project, I work with the district to understand the vision for the district (e.g., student equity), set objectives for the boundary redistricting (e.g., balanced enrollment), and define parameters that take into consideration the history of the district, reflecting parent input and community values (e.g., boundary changes should not impact students within walk zones). Guiding principles create a clear path forward and a solid foundation for district leaders and redistricting committees to build agreement.
2. Customizable Boundary Modeling
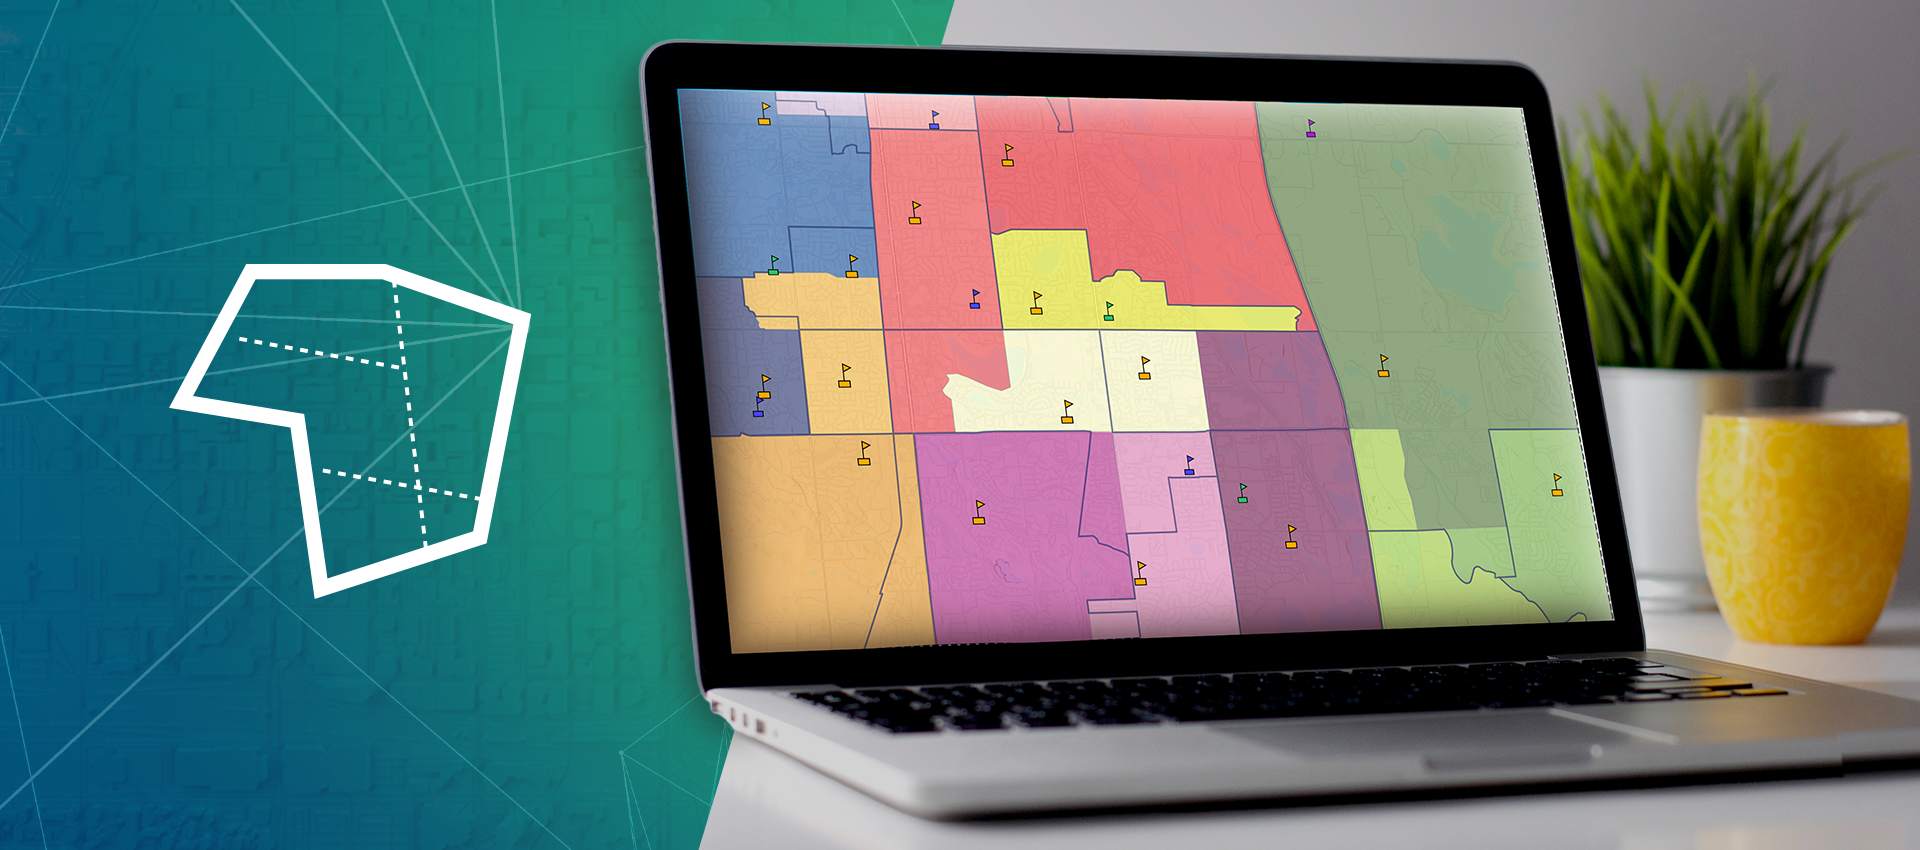
As a data modeler, this is my favorite part: creating custom models tailored for each district’s specific objectives. The modeling tools I use are flexible and adaptable, enabling updates to fit any size district, within any configuration of schools, and creating options that represent almost anything a district wants to try! Grade changes, a new school, a program move, and a feeder alignment all at once? No problem; let’s try it out.
3. Data Transparency for Community Engagement
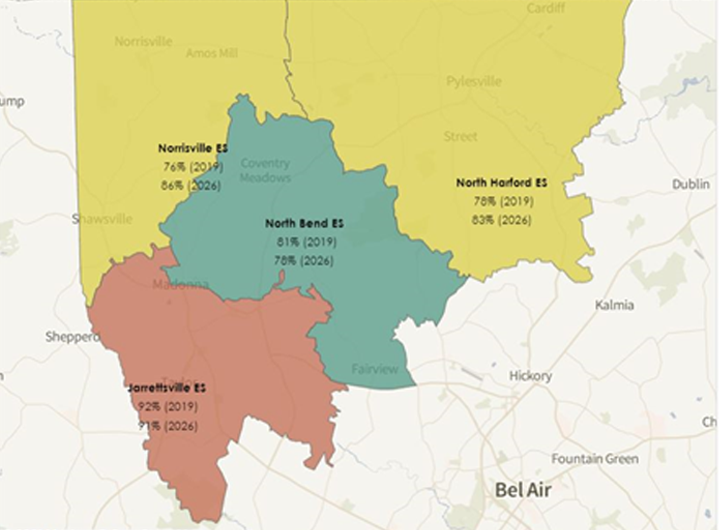
Trusting the data is a huge part of the process. When data used in modeling options are accurate and the community is able to see maps and statistics for how the data are used, they have confidence in the final recommendation. Publishing draft map options for community input that include student demographic data engages the community in the process, generates useful feedback, and garners their trust.
These three factors produce outcomes that communities and school boards can really get behind. A considered approach truly builds consensus, which is at the core of what we do at FLO.
Ready to get started? Contact our school district sector lead, Kent Martin at 509.294.6994, kmartin@flo-analytics.com. Or you can check out our Attendance Boundary Analysis and Adjustment page to learn more!


